Map tiles by
Stamen Design
, under
CC BY 3.0
. Data by
OpenStreetMap
, under
ODbL
., ©
CARTO
x
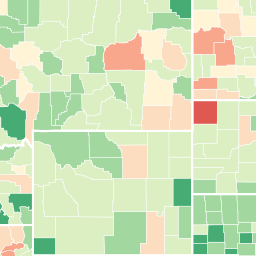
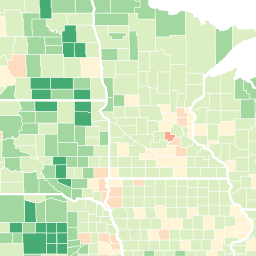
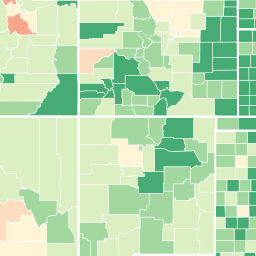
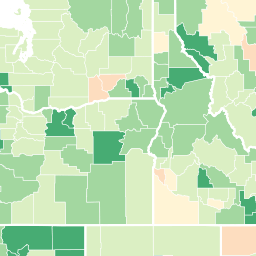
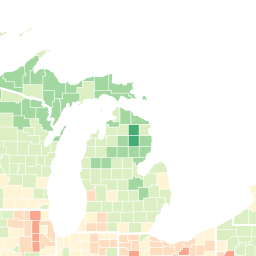
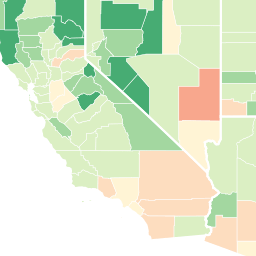
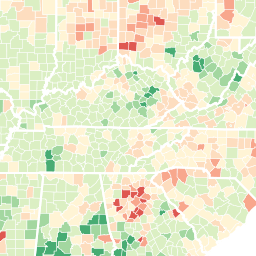
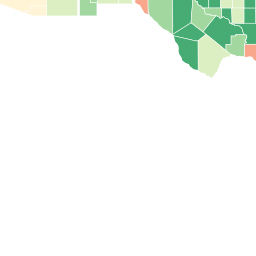
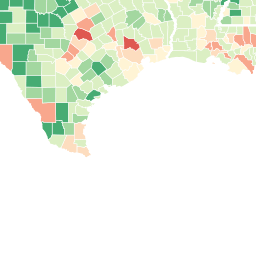
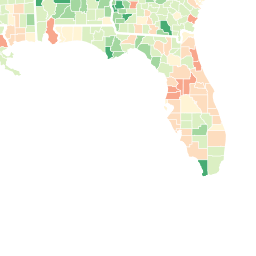
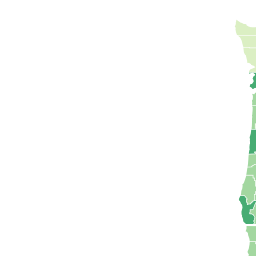
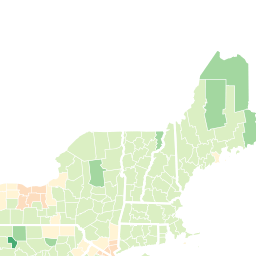
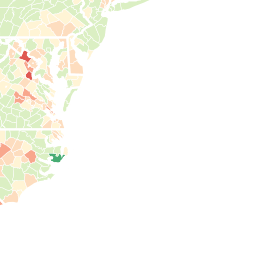
Change in Emissions (%)
-50
-30
0
10
30
60
Change in Carbon Dioxide Emissions by U.S. County
x
Share this map
Social
Share on Facebook
Share on Twitter
Link to this map
Embed this map
<iframe width='100%' height='520' frameborder='0' src='http://azavea-maps.carto.com/u/west/viz/0047cda4-691a-11e4-bcc8-0e4fddd5de28/embed_map' allowfullscreen webkitallowfullscreen mozallowfullscreen oallowfullscreen msallowfullscreen></iframe>
+
-
CARTO
This visualization only works in modern browsers. Upgrade yours and enjoy.
Safari
Chrome
Firefox
Map created by
west